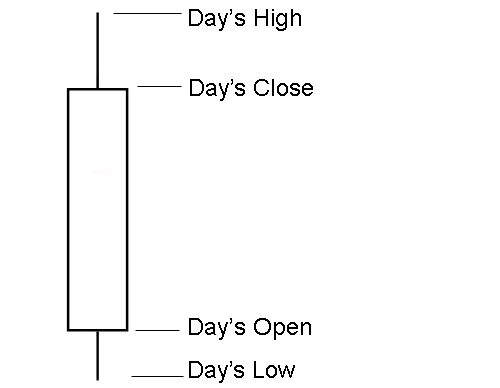
White Candlestick
A point on a candle stick chart representing a day in which the underlying price has moved up. Candlesticks will have a body and usually two wicks on each end. The bottom of the white body represents the opening price and the top of the body represents the closing price. The top and bottom tips of each wick are the day's highest and lowest price respectively.
Also known as an "open candlestick."

Candlestick charts are primarily used by technical traders because of how quick a day's price movement is conveyed. There are many formations which can be used as a buy, sell or hold indicator.
Red/black candlesticks represent a downward movement for the day, which are opposite of white candle sticks.
Most charting software will allow you to change the colors of these candles. Even though white is the common color for this type of candlestick, any color can and is used by traders.
Also known as an "open candlestick."

Candlestick charts are primarily used by technical traders because of how quick a day's price movement is conveyed. There are many formations which can be used as a buy, sell or hold indicator.
Red/black candlesticks represent a downward movement for the day, which are opposite of white candle sticks.
Most charting software will allow you to change the colors of these candles. Even though white is the common color for this type of candlestick, any color can and is used by traders.
附件列表
词条内容仅供参考,如果您需要解决具体问题
(尤其在法律、医学等领域),建议您咨询相关领域专业人士。
如果您认为本词条还有待完善,请 编辑
上一篇 Weighted Alpha 下一篇 Williams %R
