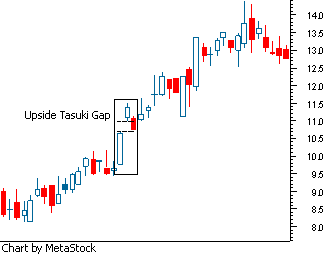
Upside Tasuki Gap
A candlestick formation that is commonly used to signal the continuation of the current trend. The pattern is formed when a series of candlesticks have demonstrated the following:
1. The bar is a large white candlestick within a defined uptrend.
2. The second bar is another white candlestick that has gapped above the close of the previous bar.
3. The last bar is a red candlestick that closes within the gap between the first two bars. It is important to note that the red candle does not need to fully close the gap.

In technical analysis, it is not uncommon to see the price of the asset close the gap created in the price. Sometimes traders get ahead of themselves and send the price higher too quickly, which can result in a slight pullback. The red candlestick that forms the upside tasuiki gap is as a period of slight consolidation before the bulls continue to send the price higher.
1. The bar is a large white candlestick within a defined uptrend.
2. The second bar is another white candlestick that has gapped above the close of the previous bar.
3. The last bar is a red candlestick that closes within the gap between the first two bars. It is important to note that the red candle does not need to fully close the gap.

In technical analysis, it is not uncommon to see the price of the asset close the gap created in the price. Sometimes traders get ahead of themselves and send the price higher too quickly, which can result in a slight pullback. The red candlestick that forms the upside tasuiki gap is as a period of slight consolidation before the bulls continue to send the price higher.
附件列表
词条内容仅供参考,如果您需要解决具体问题
(尤其在法律、医学等领域),建议您咨询相关领域专业人士。
如果您认为本词条还有待完善,请 编辑
上一篇 Up Volume 下一篇 Upside/Downside Ratio
