Rounding Bottom
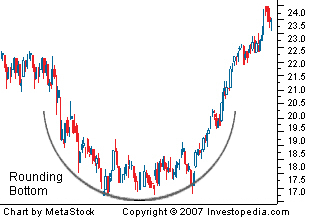
A chart pattern used in technical analysis, which is identified by a series of price movements that, when graphed, form the shape of a "U". Rounding bottoms are found at the end of extended downward trends and signify a reversal in long-term price movements. This pattern's time frame can vary from several weeks to several months and is deemed by many traders as a rare occurrence.
The chart below illustrates a rounding bottom.

A rounding bottoms look similar to the cup and handle pattern, but does not experience the temporary downward trend of the "handle" portion. The initial declining slope of a rounding bottom indicates an excess of supply, which forces the stock price down. The transfer to an upward trend occurs when buyers enter the market at a low price, which increases demand for the stock. Once the rounding bottom is complete, the stock breaks out and will continue in its new upward trend.
The chart below illustrates a rounding bottom.

A rounding bottoms look similar to the cup and handle pattern, but does not experience the temporary downward trend of the "handle" portion. The initial declining slope of a rounding bottom indicates an excess of supply, which forces the stock price down. The transfer to an upward trend occurs when buyers enter the market at a low price, which increases demand for the stock. Once the rounding bottom is complete, the stock breaks out and will continue in its new upward trend.
附件列表
词条内容仅供参考,如果您需要解决具体问题
(尤其在法律、医学等领域),建议您咨询相关领域专业人士。
如果您认为本词条还有待完善,请 编辑
上一篇 Rising Three Methods 下一篇 Rounding Top
