Point & Figure Chart
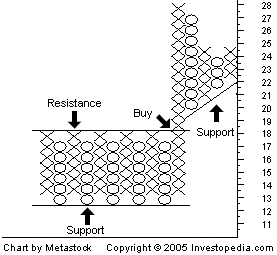
A chart that plots day-to-day price movements without taking into consideration the passage of time. Point and figure charts are composed of a number of columns that either consist of a series of stacked Xs or Os. A column of Xs is used to illustrate a rising price, while Os represent a falling price. As you can see from the chart below, this type of chart is used to filter out non-significant price movements, and enables the trader to easily determine critical support and resistance levels. Traders will place orders when the price moves beyond identified support/resistance levels.

Additional points are added to the chart once the price changes by more than a predefined amount (known as the box size). For example, if the box size is set to equal one and the price of the asset is $15, then another X will be added to the stack of Xs once the price surpasses $16. Each column consists of only one letter (either X or O) - never both. New columns are placed to the right of the previous column and are only added once the price changes direction by more than a predefined reversal amount.

Additional points are added to the chart once the price changes by more than a predefined amount (known as the box size). For example, if the box size is set to equal one and the price of the asset is $15, then another X will be added to the stack of Xs once the price surpasses $16. Each column consists of only one letter (either X or O) - never both. New columns are placed to the right of the previous column and are only added once the price changes direction by more than a predefined reversal amount.
附件列表
词条内容仅供参考,如果您需要解决具体问题
(尤其在法律、医学等领域),建议您咨询相关领域专业人士。
如果您认为本词条还有待完善,请 编辑
