Moving Average Ribbon
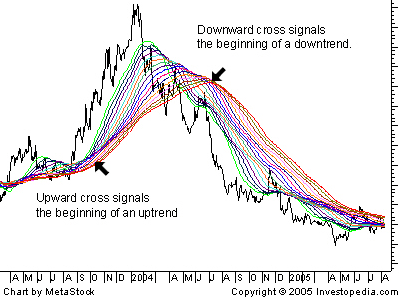
A technique used in technical analysis to identify changing trends. It is created by placing a large number of moving averages onto the same chart. When all the averages are moving in the same direction, the trend is said to be strong. Reversals are confirmed when the averages crossover and head in the opposite direction.

The moving averages used in the diagram start with the 50-day moving average and increase by 10-day periods up to the final average of 200. (50, 60, 70, 80 ... 190, 200)
Responsiveness to changing conditions is accounted for by changing the number of time periods used in the moving averages. The shorter the number of periods used to create the average, the more sensitive the ribbon is to slight price changes. For example, a series of 5, 15, 25, 35 and 45-day moving averages will be a better choice to find short-term reversals then 150, 160, 170, 180-day moving averages.
附件列表
词条内容仅供参考,如果您需要解决具体问题
(尤其在法律、医学等领域),建议您咨询相关领域专业人士。
如果您认为本词条还有待完善,请 编辑
上一篇 Moving Average Chart 下一篇 Multiple Discriminant Analysis - MDA
