Kagi Chart
A type of chart developed by the Japanese in the 1870s that uses a series of vertical lines to illustrate general levels of supply and demand for certain assets. Thick lines are drawn when the price of the underlying asset breaks above the previous high price and is interpreted as an increase in demand for the asset. Thin lines are used to represent increased supply when the price falls below the previous low.
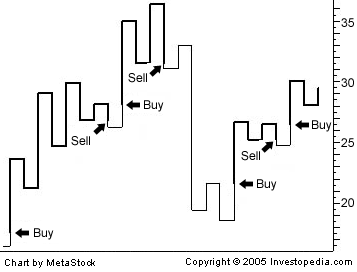
An entry signal is triggered when the vertical line changes from thin to thick and is not reversed until the thick line changes back to thin.
One important note about these charts is that they are independent of time and only change direction once a predefined reversal amount is reached.
An entry signal is triggered when the vertical line changes from thin to thick and is not reversed until the thick line changes back to thin.
One important note about these charts is that they are independent of time and only change direction once a predefined reversal amount is reached.
附件列表
词条内容仅供参考,如果您需要解决具体问题
(尤其在法律、医学等领域),建议您咨询相关领域专业人士。
如果您认为本词条还有待完善,请 编辑
上一篇 Island Reversal 下一篇 Kairi Relative Index