Hammer
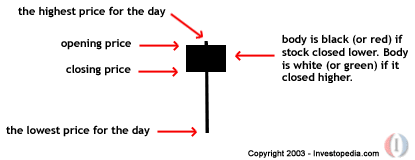
A price pattern in candlestick charting that occurs when a security trades significantly lower than its opening, but rallies later in the day to close either above or close to its opening price. This pattern forms a hammer-shaped candlestick.

A hammer occurs after a security has been declining, possibly suggesting the market is attempting to determine a bottom.
The signal does not mean bullish investors have taken full control of a security, it simply indicates that the bulls are strengthening.

A hammer occurs after a security has been declining, possibly suggesting the market is attempting to determine a bottom.
The signal does not mean bullish investors have taken full control of a security, it simply indicates that the bulls are strengthening.
附件列表
词条内容仅供参考,如果您需要解决具体问题
(尤其在法律、医学等领域),建议您咨询相关领域专业人士。
如果您认为本词条还有待完善,请 编辑
上一篇 Growth Curve 下一篇 Harami Cross
