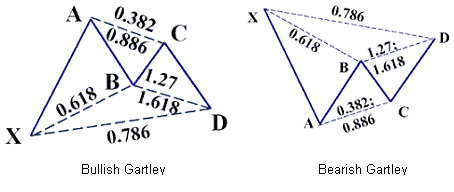
Gartley Pattern
In technical analysis, it is a complex price pattern based on Fibonacci numbers/ratios. It is used to determine buy and sell signals by measuring price retracements of a stock's up and down movement in stock price.

Source: www.harmonictrader.com
The above Gartley example shows an uptrend XA with a price reversal at A. Using Fibonacci ratios, the retracement AB should be 61.8% of the price range A minus X, as shown by line XB. At B, the price reverses again. Ideally, retracement BC should be between 61.8% and 78.6% of the AB price range, not the length of the lines, and is shown along the line AC. At C, the price again reverses with retracement CD between 127% and 161.8% of the range BC and is shown along the line BD. Price D is the point to buy/sell (bullish/bearish Gartley pattern) as the price is about to increase/decrease.
附件列表
词条内容仅供参考,如果您需要解决具体问题
(尤其在法律、医学等领域),建议您咨询相关领域专业人士。
如果您认为本词条还有待完善,请 编辑
上一篇 Gann Angles 下一篇 Gravestone Doji
