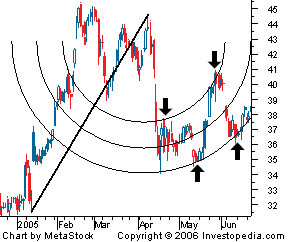
Fibonacci Arc
A charting technique consisting of three curved lines that are drawn for the purpose of anticipating key support and resistance levels, and areas of ranging.

Fibonacci arcs are created by first drawing an invisible trendline between two points (usually the high and low in a given period), and then by drawing three curves that intersect this trendline at the key Fibonacci levels of 38.2%, 50% and 61.8%. Transaction decisions are made when the price of the asset crosses through these key levels.

Fibonacci arcs are created by first drawing an invisible trendline between two points (usually the high and low in a given period), and then by drawing three curves that intersect this trendline at the key Fibonacci levels of 38.2%, 50% and 61.8%. Transaction decisions are made when the price of the asset crosses through these key levels.
附件列表
词条内容仅供参考,如果您需要解决具体问题
(尤其在法律、医学等领域),建议您咨询相关领域专业人士。
如果您认为本词条还有待完善,请 编辑
上一篇 False Signal 下一篇 Fibonacci Channel
