Equivolume
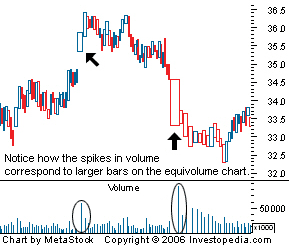
A chart that compares price and volume and plots them together as one piece of data. The height of each bar represents the high and low for each period and the width represents the volume relative to the total shares traded over the time period being analyzed.

This type of chart is very similar to Japanese candlesticks except that volume is incorporated into the data point rather than added as an indicator on the side. Generally, a wide bar is deemed to be more significant than a thin bar because large volume usually precedes a significant price move.

This type of chart is very similar to Japanese candlesticks except that volume is incorporated into the data point rather than added as an indicator on the side. Generally, a wide bar is deemed to be more significant than a thin bar because large volume usually precedes a significant price move.
附件列表
词条内容仅供参考,如果您需要解决具体问题
(尤其在法律、医学等领域),建议您咨询相关领域专业人士。
如果您认为本词条还有待完善,请 编辑
上一篇 Elder-Ray Index 下一篇 Evening Star
