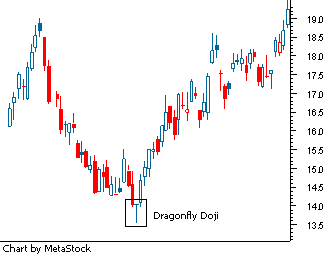
Dragonfly Doji
A type of candlestick pattern that signals indecision among traders. The pattern is formed when the stock's opening and closing prices are equal and occur at the high of the day. The long lower shadow suggests that the forces of supply and demand are nearing a balance and that the direction of the trend may be nearing a major turning point.

A dragonfly doji pattern is a relatively difficult chart pattern to find, but when it is found within a defined trend it is often deemed to be a reliable signal that the trend is about to change direction. As you can see from the chart, on the day of the dragonfly doji (shown within the black box), traders realize that the price was sold down to unjustifiably low levels so they send the price back up to where the stock opened. The close near the day's open suggests that demand is again starting to outweigh supply.

A dragonfly doji pattern is a relatively difficult chart pattern to find, but when it is found within a defined trend it is often deemed to be a reliable signal that the trend is about to change direction. As you can see from the chart, on the day of the dragonfly doji (shown within the black box), traders realize that the price was sold down to unjustifiably low levels so they send the price back up to where the stock opened. The close near the day's open suggests that demand is again starting to outweigh supply.
附件列表
词条内容仅供参考,如果您需要解决具体问题
(尤其在法律、医学等领域),建议您咨询相关领域专业人士。
