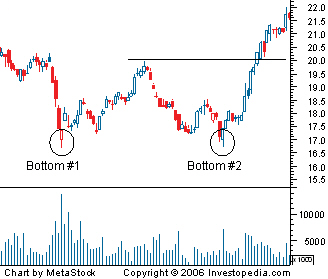
Double Bottom
A charting pattern used in technical analysis. It describes the drop of a stock (or index), a rebound, another drop to the same (or similar) level as the original drop, and finally another rebound.

The double bottom looks like the letter "W". The twice touched low is considered a support level.
Most technical analysts believe that the advance off of the first bottom should be 10-20%. The second bottom should form within 3-4% of the previous low, and volume on the ensuing advance should increase.
附件列表
词条内容仅供参考,如果您需要解决具体问题
(尤其在法律、医学等领域),建议您咨询相关领域专业人士。
如果您认为本词条还有待完善,请 编辑
上一篇 Donchian Channels 下一篇 Double Exponential Moving Average - DEMA
