Crossover
The point on a stock chart when a security and an indicator intersect. Crossovers are used by technical analysts to aid in forecasting the future movements in the price of a stock. In most technical analysis models, a crossover is a signal to either buy or sell.
Below we have a stock that falls below its 20-day moving average - a bearish sign.
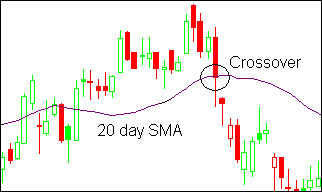
An example of a crossover would be when the security line breaks through its 25-day moving average which may be a signal to buy the stock. Some of the indicators that use crossovers are "moving average" and "Bollinger bands".
附件列表
词条内容仅供参考,如果您需要解决具体问题
(尤其在法律、医学等领域),建议您咨询相关领域专业人士。
如果您认为本词条还有待完善,请 编辑