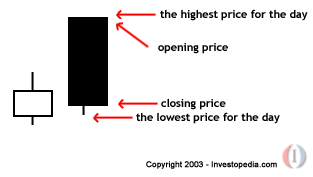
Bearish Belt Hold
A candlestick pattern that forms during an upward trend. This is what happens in the pattern: following a stretch of bullish trades, a bearish or black candlestick occurs; the opening price, which becomes the high for the day, is higher than the close of the previous day; the stock price declines throughout the day, resulting in a long black candlestick with a short lower shadow and no upper shadow.

This pattern often signals a reverse in investor sentiment from bullish to bearish. However, the bearish belt hold is not considered very reliable as it occurs frequently and is often incorrect in predicting future share prices. As with any other candlestick charting method, more than two days of trading should be considered when making predictions about trends.

This pattern often signals a reverse in investor sentiment from bullish to bearish. However, the bearish belt hold is not considered very reliable as it occurs frequently and is often incorrect in predicting future share prices. As with any other candlestick charting method, more than two days of trading should be considered when making predictions about trends.
附件列表
词条内容仅供参考,如果您需要解决具体问题
(尤其在法律、医学等领域),建议您咨询相关领域专业人士。
如果您认为本词条还有待完善,请 编辑
上一篇 Bearish Abandoned Baby 下一篇 401(a) Plan
