Ascending Triangle
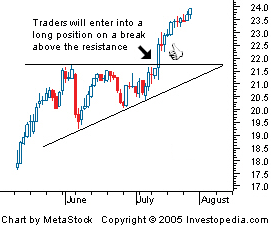
A bullish chart pattern used in technical analysis that is easily recognizable by the distinct shape created by two trendlines. In an ascending triangle, one trendline is drawn horizontally at a level that has historically prevented the price from heading higher, while the second trendline connects a series of increasing troughs. Traders enter into long positions when the price of the asset breaks above the top resistance. The chart below is an example of an ascending triangle:

An ascending triangle is generally considered to be a continuation pattern, meaning that it is usually found amid a period of consolidation within an uptrend. Once the breakout occurs, buyers will aggressively send the price of the asset higher, usually on high volume. The most common price target is generally set to be equal to the entry price plus the vertical height of the triangle.
An ascending triangle is the bullish counterpart of a descending triangle.
附件列表
词条内容仅供参考,如果您需要解决具体问题
(尤其在法律、医学等领域),建议您咨询相关领域专业人士。
如果您认为本词条还有待完善,请 编辑
上一篇 Ascending Tops 下一篇 Attribution Analysis
