Williams %R
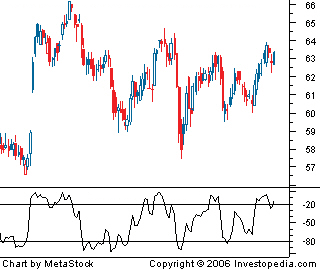
In technical analysis, this is a momentum indicator measuring overbought and oversold levels, similar to a stochastic oscillator. It was developed by Larry Williams and compares a stock's close to the high-low range over a certain period of time, usually 14 days.

It is used to determine market entry and exit points. The Williams %R produces values from 0 to -100, a reading over 80 usually indicates a stock is oversold, while readings below 20 suggests a stock is overbought.

It is used to determine market entry and exit points. The Williams %R produces values from 0 to -100, a reading over 80 usually indicates a stock is oversold, while readings below 20 suggests a stock is overbought.
