Triple Top
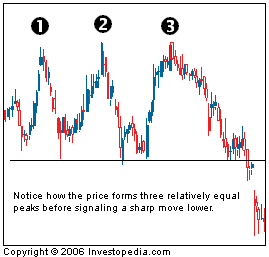
A pattern used in technical analysis to predict the reversal of a prolonged uptrend. This pattern is identified when the price of an asset creates three peaks at nearly the same price level. The bounce off the resistance near the third peak is a clear indication that buying interest is becoming exhausted. It is used by traders to predict the reversal of the uptrend.

The three consecutive tops make this pattern visually similar to the head and shoulders pattern but, in this case, the middle peak is nearly equal to the other peaks rather than being higher. Many traders will enter into a short position once the price of the asset falls below the identified support level (shown by the black line in the chart above)

The three consecutive tops make this pattern visually similar to the head and shoulders pattern but, in this case, the middle peak is nearly equal to the other peaks rather than being higher. Many traders will enter into a short position once the price of the asset falls below the identified support level (shown by the black line in the chart above)
附件列表
词条内容仅供参考,如果您需要解决具体问题
(尤其在法律、医学等领域),建议您咨询相关领域专业人士。
如果您认为本词条还有待完善,请 编辑
上一篇 Triple Exponential Moving Average - TEMA 下一篇 True Strength Index - TSI
