Symmetrical Triangle
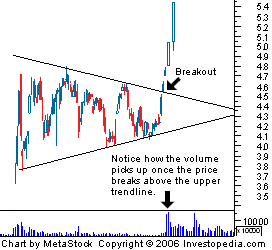
A chart pattern used in technical analysis that is easily recognized by the distinct shape created by two converging trendlines. The pattern is identified by drawing two trendlines that connect a series of sequentially lower peaks and a series of sequentially higher troughs. Both trendlines act as barriers that prevent the price from heading higher or lower, but once the price breaches one of these levels, a sharp movement often follows.

A symmetrical triangle is generally regarded as a period of consolidation before the price moves beyond one of the identified trendlines. A break below the lower trendline is used by technical traders to signal a move lower, while a break above the upper trendline signals the beginning of a move upward. As you can see from the chart above, technical traders use a sharp increase in volume or any other available technical indicator to confirm a breakout beyond one of the trendlines.
The sharp price movement that often follows a breakout of this formation can be captured by traders who are able to identify the pattern early enough.
附件列表
词条内容仅供参考,如果您需要解决具体问题
(尤其在法律、医学等领域),建议您咨询相关领域专业人士。
如果您认为本词条还有待完善,请 编辑
上一篇 Swing Low 下一篇 Technical Analysis
