摘要: A recommendation to buy a specific security when a the security's price exceeds a certain level of resistance by placing a buy stop order at that level of resistance. The trader's belief is that a g[阅读全文:]
摘要: A proactive trading strategy in which a trader takes profits by closing out of a short position or buying into a long position. This strategy is used when the price of the asset being traded is still [阅读全文:]
摘要: A trend indicated by a large candlestick followed by a much smaller candlestick whith a that body is located within the vertical range of the larger candle's body. Such a pattern is an indication tha[阅读全文:]
摘要: The most common type of distribution for a variable. The term "bell curve" comes from the fact that the graph used to depict a normal distribution consists of a bell-shaped line.
The bell cu[阅读全文:]
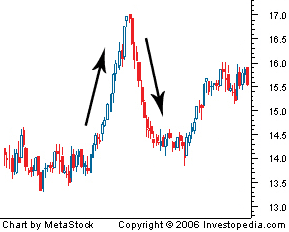
摘要: A steep and rapid increase in price followed by a steep and rapid drop in price.
 [阅读全文:]
摘要: A band plotted two standard deviations away from a simple moving average, developed by famous technical trader John Bollinger.
摘要: In the context of Point & Figure Charts, the box size is the minimum price change that must occur for a given period before a mark (an X or an O) is added to the chart.
You can filte[阅读全文:]
摘要:
A mathematical model designed to forecast data within a time series. The Box-Jenkin model alters the time series to make it stationary by using the differences between data points. This allows the [阅读全文:]
摘要: A specific type of indicator that uses advancing and declining issues to determine the amount of participation in the movement of the stock market.
There are several different types of breadth [阅读全文:]
摘要: A technical analysis theory that predicts the strength of the market according to the number of stocks that advance or decline in a particular trading day.
The breadth of market indicator is us[阅读全文:]