摘要: A trend in candlestick charting that occurs during a downward movement. After a stretch of bearish candlesticks, a bullish or white candlestick forms. The opening price, which becomes the low for the [阅读全文:]
摘要: A chart pattern that forms when a small black candlestick is followed by a large white candlestick that completely eclipses or "engulfs" the previous day's candlestick. The shadows or tails of the [阅读全文:]
摘要: A candlestick chart pattern in which a large candlestick is followed by a smaller candlestick whose body is located within the vertical range of the larger body. In terms of candlestick colors, the bu[阅读全文:]
摘要: A trend indicated by a large candlestick followed by a much smaller candlestick whose body is located within the vertical range of the larger candle's body. In both candlesticks, the stock price has [阅读全文:]
摘要: A recommendation to buy a specific security when a the security's price exceeds a certain level of resistance by placing a buy stop order at that level of resistance. The trader's belief is that a g[阅读全文:]
摘要: A proactive trading strategy in which a trader takes profits by closing out of a short position or buying into a long position. This strategy is used when the price of the asset being traded is still [阅读全文:]
摘要: A trend indicated by a large candlestick followed by a much smaller candlestick whith a that body is located within the vertical range of the larger candle's body. Such a pattern is an indication tha[阅读全文:]
摘要: The most common type of distribution for a variable. The term "bell curve" comes from the fact that the graph used to depict a normal distribution consists of a bell-shaped line.
The bell cu[阅读全文:]
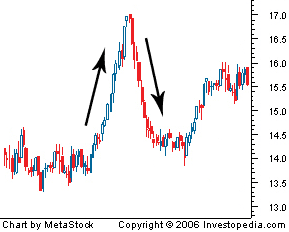
摘要: A steep and rapid increase in price followed by a steep and rapid drop in price.
 [阅读全文:]
摘要: A band plotted two standard deviations away from a simple moving average, developed by famous technical trader John Bollinger.